The chemical industry maintained its position as the second-largest exporting sector by export figures in September 2019. According to data from the Istanbul Chemical Substances and Products Exporters Association (İKMİB), the chemical industry achieved USD 1.65 billion in exports in September 2019.
Looking at monthly performance, the chemical sector recorded a 7.62% increase in September 2019 exports compared to September 2018. The chemical sector, which continues its upward trend, exceeded USD 15 billion in exports over the last 9 months with a 17.47% increase.
Adil Pelister, Chairman of the Board of the Istanbul Chemical Substances and Products Exporters Association (İKMİB), evaluated the chemical sector export figures. Pelister stated: "As our chemical exports improve performance month after month, we continue to grow
as the second sector achieving the highest exports.
Based on September 2019 data, we achieved USD 1.65 billion in exports, achieving a 7.62% increase in our chemical exports compared to September of the previous year. While we are making steady progress toward our target of USD 20 billion in exports for the end of 2020, our chemical exports have already exceeded USD 15 billion in the first 9 months of the year.
Together with our 16 subsectors under the İKMİB umbrella, we are working with all our might to take our chemical exports to the next level, and we are pleased to be bringing dynamism to the Turkish economy.
In the Export Master Plan and New Economy Program, we can see that the chemical sector is among the most strategic sectors for our country's economy. In line with this vision, we are aware of the duties and responsibilities incumbent on us as chemical exporters.
Particularly in achieving our country's target of USD 100 billion in trade volume with the United States, our industrialists and chemical exporters have a major role to play.
In the coming period, as chemical exporters, we will work even harder to continue our growth with our newly developed high value-added products and our priority perspective on brand, technology and innovation.
Without slowing down, we will continue to be one of the pioneering sectors of change by focusing on growth, production and exports with all our strength." he said.
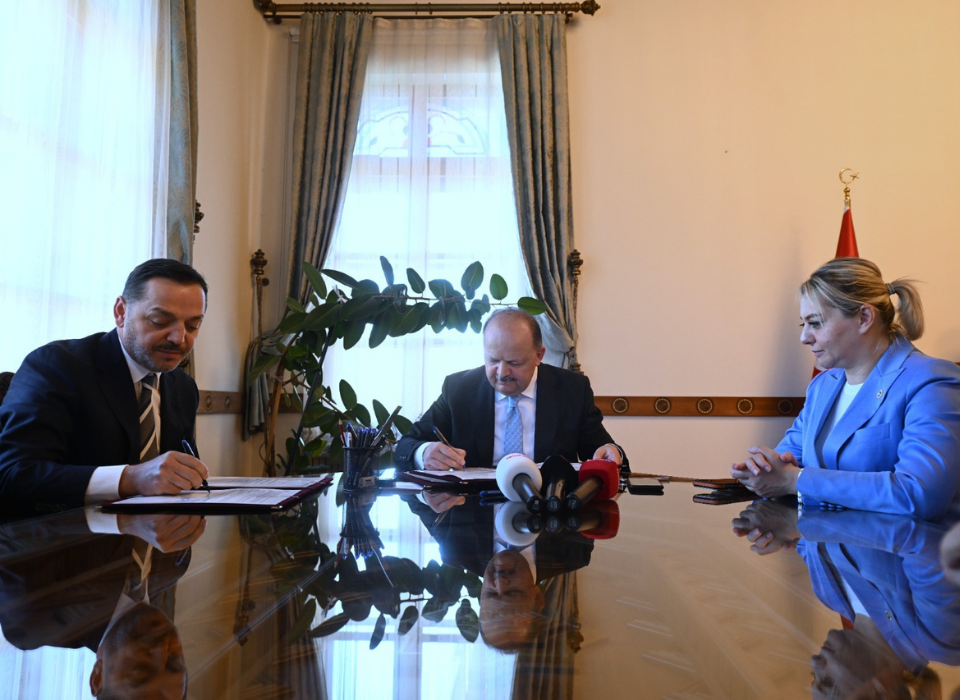
Pointing to İKMİB's cooperation with UPS and Turkish Airlines Aviation Academy, Pelister stated: "Within the scope of our cooperation, we aim to remove another obstacle in front of exports. We are facilitating the transport and sample shipment of chemical substances.
İKMİB members will be able to send samples by obtaining the Dangerous Goods Regulations (DGR/Category 1,2,3,6) Training (IATA certification) from Turkish Airlines Aviation Academy and benefiting from the advantageous prices offered by UPS.
However, in accordance with the decision we took in the Management Board, 50% of the training fee for the Dangerous Goods Regulations (DGR/Category 1,2,3,6) Training (IATA certification) will be covered by our Association for the first 100 member representatives who apply.
In addition, we expect the cooperation conducted to accelerate rapid exports conducted with ETGB (Electronic Commerce Customs Declaration) and boost small package exports," he explained.
Italy was the country with the highest chemical exports in September. Iraq, Egypt, the Netherlands, Germany, Saudi Arabia, Lebanon, the United States, the United Kingdom and Ukraine were the top ten countries following Italy.
Chemical exports to Italy in September 2019 amounted to USD 121,585,526.80. In September, the most exported products to Italy were "mineral fuels, mineral oils and products," "plastics and articles thereof," "organic chemicals," "inorganic chemicals," "rubber and rubber articles," "fertilizers," "essential oils, cosmetics and soap," "pharmaceutical products," "paints, varnishes, inks and preparations." Nine-month chemical exports to Italy this year reached USD 722,433,000.
Among the countries with the highest chemical exports in the January-September 2019 period, the Netherlands, Spain, Italy, Iraq, Germany, Egypt, the United States, Malta, Greece and the United Kingdom ranked in the top ten.
In subsectors,
plastics and articles thereof exports ranked first in September chemical exports with USD 514,891,287.
Second place was held by
mineral fuels, mineral oils and products with USD 432,862,126 in exports, while
inorganic chemicals ranked
third with USD 139,688,089 in exports.
Following inorganic chemicals, other sectors in the top ten were: 'rubber and rubber articles,' 'essential oils, cosmetics and soap,' 'pharmaceutical products,' 'paints, varnishes, inks and preparations,' 'miscellaneous chemical substances,' 'organic chemicals,' and 'detergents.'
2019 monthly chemical exports
| MONTH |
2018 VALUE ($) |
2019 VALUE ($) |
CHANGE (%) |
| January |
1,353,531,654.21 |
1,539,694,513.16 |
13.75% |
| February |
1,265,531,849.44 |
1,645,426,398.92 |
30.02% |
| March |
1,566,978,246.63 |
1,840,066,554.84 |
17.43% |
| April |
1,353,909,699.99 |
1,771,802,910.79 |
30.87% |
| May |
1,467,443,906.34 |
1,938,759,467.38 |
32.12% |
| June |
1,423,566,900.00 |
1,298,278,200.32 |
-8.80% |
| July |
1,477,099,160.88 |
1,739,538,554.31 |
17.77% |
| August |
1,378,639,701.35 |
1,636,348,873.53 |
18.69% |
| September |
1,535,121,767.61 |
1,652,079,833.81 |
7.62% |
Countries with the highest chemical exports in September 2019
| NO. |
Country |
SEPTEMBER 2018 VALUE ($) |
SEPTEMBER 2019 VALUE ($) |
CHANGE VALUE (%) |
| 1 |
ITALY |
43,038,572.98 |
121,585,526.80 |
182.50% |
| 2 |
IRAQ |
82,461,418.97 |
104,640,778.83 |
26.90% |
| 3 |
EGYPT |
105,576,760.20 |
75,220,804.85 |
-28.75% |
| 4 |
NETHERLANDS |
26,429,366.32 |
71,083,207.28 |
168.96% |
| 5 |
GERMANY |
74,647,098.07 |
66,896,335.96 |
-10.38% |
| 6 |
SAUDI ARABIA |
46,466,074.73 |
60,969,432.05 |
31.21% |
| 7 |
LEBANON |
7,262,327.19 |
53,937,600.93 |
642.70% |
| 8 |
UNITED STATES OF AMERICA |
56,206,984.40 |
45,355,116.02 |
-19.31% |
| 9 |
UNITED KINGDOM |
42,552,117.61 |
45,319,109.85 |
6.50% |
| 10 |
UKRAINE |
22,340,218.14 |
42,940,375.86 |
92.21% |
September 2019 chemical sector export subsectors
| |
|
|
2018-2019 |
| |
SEPTEMBER 2018 |
SEPTEMBER 2019 |
% CHANGE |
| PRODUCT GROUP |
VALUE ($) |
VALUE ($) |
VALUE |
| PLASTICS AND ARTICLES THEREOF |
486,040,360 |
514,891,287 |
5.94% |
| MINERAL FUELS, MINERAL OILS AND PRODUCTS |
331,688,218 |
432,862,126 |
30.50% |
| INORGANIC CHEMICALS |
152,578,458 |
139,688,089 |
-8.45% |
| RUBBER AND RUBBER ARTICLES |
108,343,878 |
104,128,939 |
-3.89% |
| ESSENTIAL OILS, COSMETICS AND SOAP |
96,096,904 |
101,639,202 |
5.77% |
| PHARMACEUTICAL PRODUCTS |
66,256,073 |
86,978,170 |
31.28% |
| PAINTS, VARNISHES, INKS AND PREPARATIONS |
70,055,525 |
73,802,230 |
5.35% |
| MISCELLANEOUS CHEMICAL SUBSTANCES |
48,794,649 |
55,770,374 |
14.30% |
| ORGANIC CHEMICALS |
76,194,273 |
46,757,910 |
-38.63% |
| DETERGENTS |
40,435,708 |
41,889,597 |
3.60% |
| FERTILIZERS |
40,584,969 |
30,703,544 |
-24.35% |
| ADHESIVES, GLUES, ENZYMES |
16,060,823 |
20,978,858 |
30.62% |
| PHOTOGRAPHIC AND CINEMATOGRAPHIC PRODUCTS |
1,005,383 |
963,395 |
-4.18% |
| EXPLOSIVES AND EXPLOSIVE SUBSTANCES AND DERIVATIVES |
924,122 |
948,748 |
2.66% |
| GLYCERIN, VEGETABLE PRODUCTS, DEGRA, FATTY SUBSTANCES |
52,206 |
59,722 |
14.40% |
| PROCESSED ASBESTOS AND MIXTURES, ARTICLES |
10,219 |
17,641 |
72.63% |
| TOTAL |
1,535,121,768 |
1,652,079,834 |
7.62% |
Source: İKMİB